Summary:
Tools to estimate your individual dose response for injectable testosterone ester in comparison to a normal distribution (95 percentile confidence estimate) of adult males (Ref). Plot below shows a summary of data from (1) clinical trials gathered from the literature + (2) crowdsourced data gathered here and elsewhere. I’ll add to the dose response chart as time allows. More background info on charts below can be found here and here in particular.
Key considerations:
If you are testing at TT levels above 1500 ng/dl expected, get an LC/MS-MS assay (always a good choice actually)
Make sure you gear is dosed correctly (third party testing)
Use graph and table below to confirm you are even in the vicinity of expected range
Make sure you test at least 4 weeks after you have made a protocol change
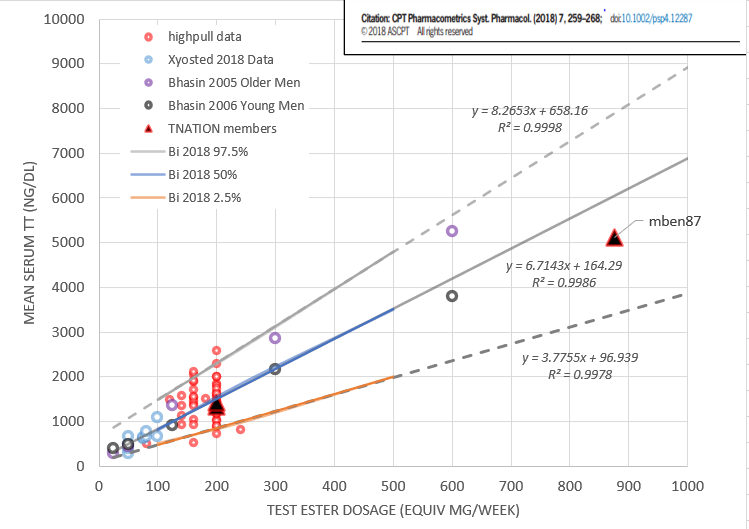
Plot shows mean TT level (ng/dl) vs weekly equivalent dose of test ester (mg/week). Test at trough and use table to convert to mean based on your protocol (E7D, E3.5D, etc).
Table: conversion between peak/trough/mean for first order absorption/elimination PK model assuming 4.5 day elimination half life and 8 hr absorption half life
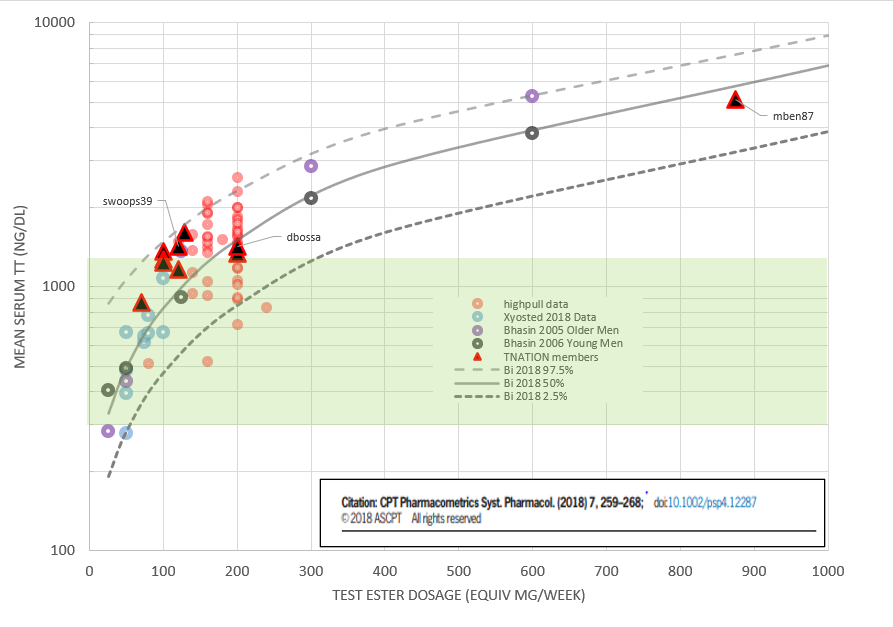
Fig. Mean TT level vs weekly equivalent dose (mg/week). Note green shaded area is 5 percentile to ~99 percentile+ physiologic reference range (300-1200 ng/dl)
Example:
Dude is taking 200 mg/week of TC (Q3.5D protocol). He measures at trough and tests at 1000 ng/dl. Using table above for Q3.5D protocol, mean/trough = 1.2. Therefore mean TT = 1.2*1000 = 1200 ng/dl. Plot the point on the curve and you see he’s less than 50%tile on his dose response (~25-30% eyeballing). From the figure at 200 mg/week dose, 2.5 percentile response ~800 ng/dl mean, 50 percentile is ~1500 ng/dl mean, and 97.5 percentile is 2300 ng/dl mean.
Interesting stuff! Based on this I would be below the 50th percentile for the doses I’ve had. I’ve increased TRT a bit with my MD, it’ll be interesting to see if the trend continues the same, which it should. Thanks for sharing @tareload
Ok, I’ve expanded the domain and range to cover a wider area since this is the Pharma section. Linear plot first then log scale on y-axis in second plot to show physiologic area and supra area as the same size on the graph.
A few TNation numbers on the graph now too. Since @mnben87 was an early adopter of this tool and he gave his results I’ve put him on there as an honorarium. Also you can click on these graphs and zoom in. Of course @highpull 's sample also included as its own data set.
From you table above what ratio would you use to find a naturals mean testosterone given they measure at peak? Helps to compare my cruise and blast numbers to natural numbers for me is why I ask.
Excellent question. Tool above is for exogenous T use only (really based on IM model of pharmacokinetics with testosterone ester).
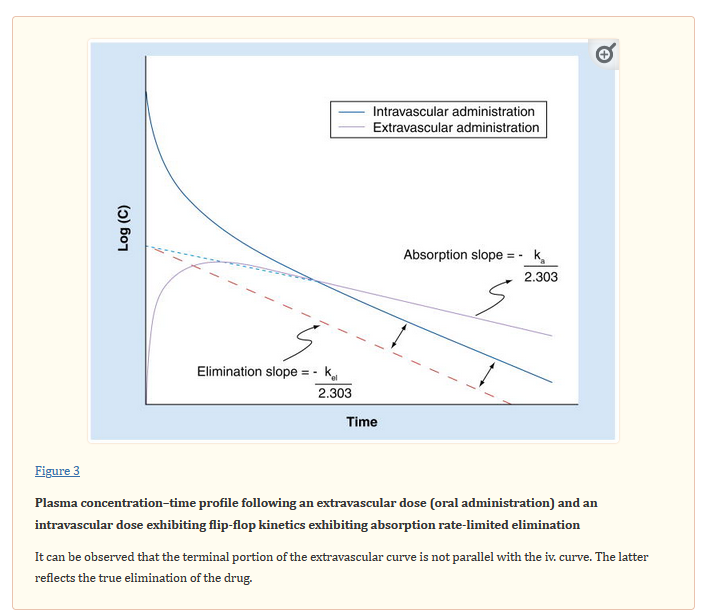
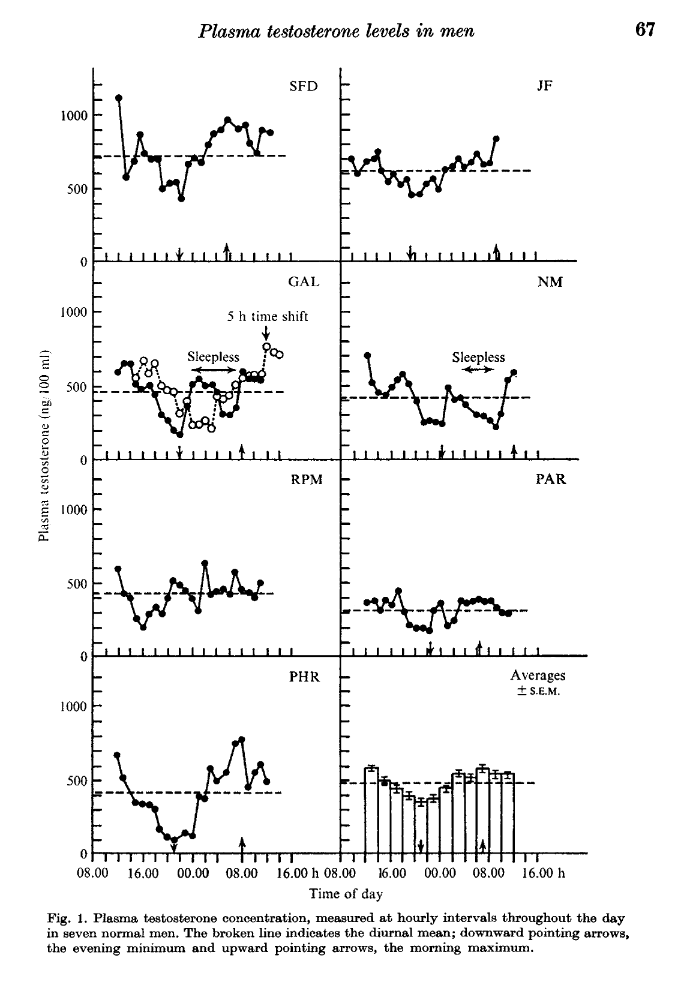
If you wanted to get natty mean/peak ratio there are some good graphs over in the other thread i did on intraday profiles from the 70s and 80s.
Example:
As you can see the peak to mean ratio varies among individual and is higher typically in the younger population. Unless you went to the trouble of doing intraday hourly testing for 24 hours back when you were natty then these examples are about the best you can do since you dont have your daily AUC from the natural peak you may have measured. Does that make sense?
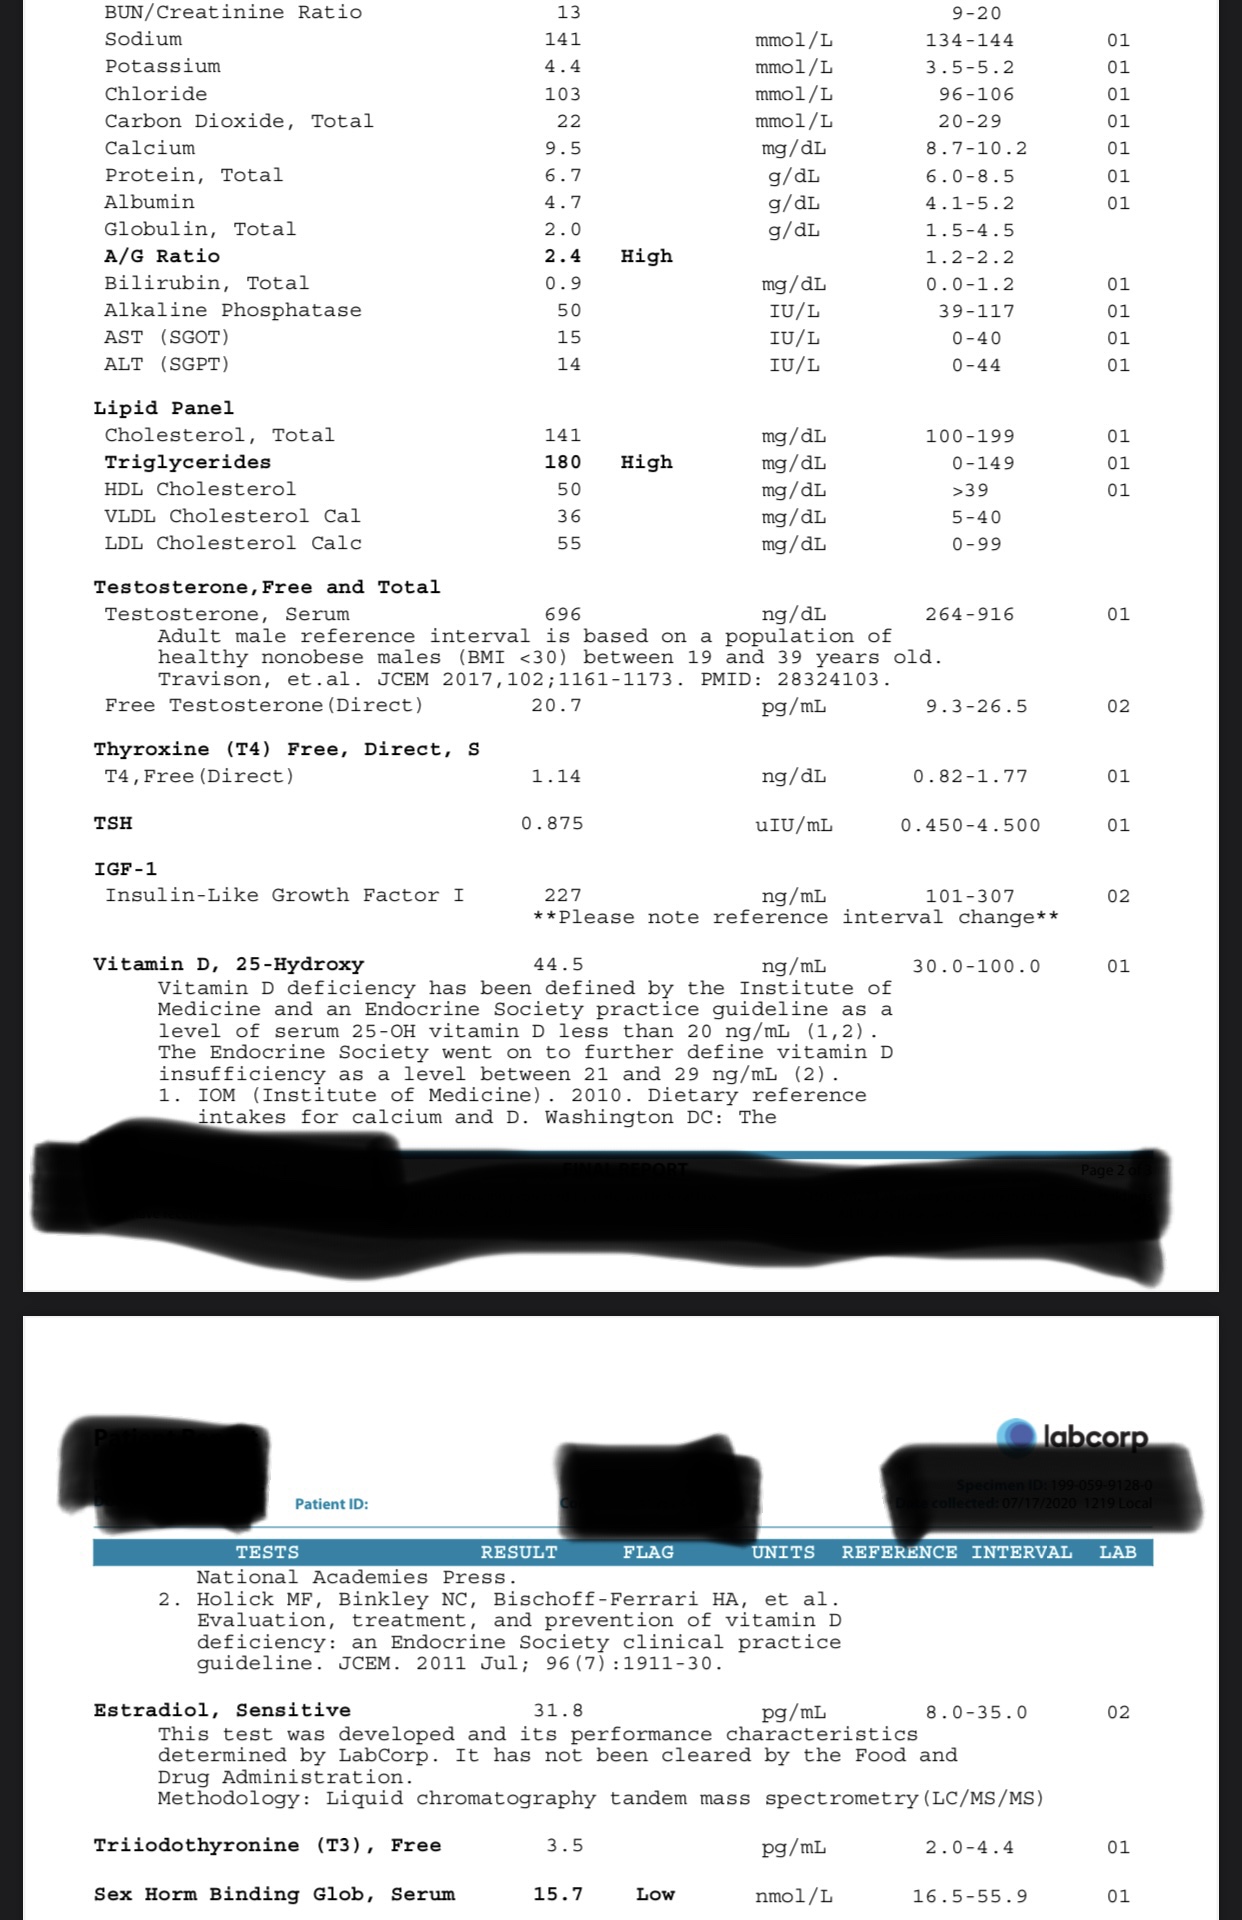
Got small lab panel back today:
4 weeks
120mg weekly, split every 3.5d, labs taken Monday AM before shot
LC/MS-MS for TT, result 1179ng/dL
SHBG consistently 35-37nmol
Updated with some data labels and a few of mine. Quite the variation of dose response and all within the 95% limits so far at TNation.
@swoops39 and I have similar free T elimination rate and SHBG. dbossa right in the middle and @mnben87 below the 50 percentile. All of us are fearfully and wonderfully made .
Thanks for playing. Turned out better than I thought it would without any cheating.
PS: our good buddy (DB) wasn’t the outlier he claimed to be with respect to dose response. In fact he was quite average from what I compute here. Amazing what a little math will do to illuminate a dark corner. Carry on though, nothing to see here.
Feel free to share your trajectory over time or a representative data point. Thank you.
Caution when considering data points where you are using 17AA along with Test or even another injectable may skew your SHBG and move you percentile wise on the TT vs dose plot. Ideally we would do this with accurate fT measurements but alas that is not an option. Oh well maybe in the future when the concepts of fT, SHBG and TT are appreciated by most
3 days post injection. All results are well into protocol
Listed so stable levels. All those test results are RX. I have some somewhere on ~800mg/wk that was UGL but third party tested.